Tag Archives: LCD module

About LED Back light driving methods

About LED Back light driving methods

( A Hantronix Application Note )

 LED Back Light Driving Methods

I. Introduction:
LED back lights on LCD modules are generally driven with a DC voltage through a
current limiting resistor. This simple approach is perfectly acceptable for most
applications. When the primary consideration is an extra bright display, the lowest
possible power consumption, or a back light that can be controlled over a very wide
brightness range another method is needed. The purpose of the paper is to describe this
method.

II. Description:
By using a pulse width modulation scheme several advantages can be realized over the
simple DC voltage method. The main advantage is in efficiency. The LED’s are pulsed
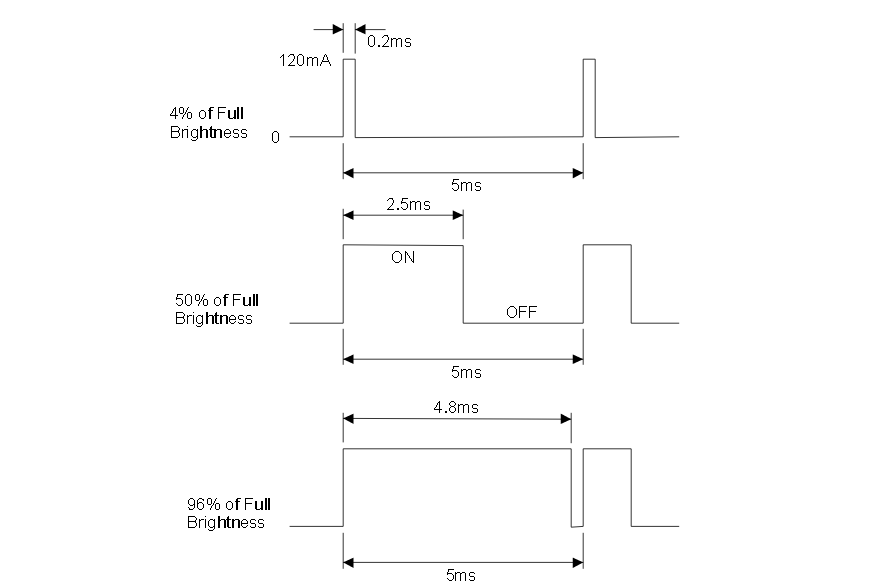
with a high current for a short period of time. For example consider the HDM16216L-7.
The nominal LED driving current for this display is 120 mA which produces a typical
brightness of 50 NIT. If, instead of a DC or constant current, we apply5 times the current,
600ma, for 1/5 of the time, the average current is the same, 120ma. See Figure #1. The
average brightness of the LED would also be the same if measured electronically. The
difference is in the perceived brightness

leddim1


The human eye has a certain amount of persistence. If exposed to a bright light the eye
will “remember” the light for a short period of time. This allows us to view a motion
picture or TV screen as a steady image when in fact it is flickering at 24 to 30 times a
second. When the LED is flashed on brightly for a short time and then turned off the eye
“remembers” the light at the high brightness level. The result is that the perceived
brightness of the back light is closer to the high pulsed brightness than to the lower DC
brightness.

This effect can be used to advantage in several ways. If the brightest possible back light is needed the display can be pulsed at a 1:4 on/off ratio with5 times the typical current. The pulse repetition frequency should be greater than 100Hz so the flickering is not perceptible to the eye but not greater than about 1kHz.

This technique can also be used to give a “normal” looking brightness level to the display
but at a lower average current to save power. The average power can be cut by a factor
of at least 50% to produce a given perceived brightness level. This can be a big advantage in battery operated equipment.

The third use of this method is to facilitate a wide range brightness control for the LED
back light. By varying the on/off ratio a very wide range of brightness can be achieved
while maintaining a very even appearing back light. See Figure #2. One can also very the
brightness by simply varying the DC current to the LED’s but at low current the individual
LED emitters start to become visible resulting in an uneven looking back light. To implement this technique the peak current should be set at the specified typical current for the display and the on/off ration of the pulses varied from near 100% on to near 0% on.

leddim2


Temperature compensation for LCD Display

Temperature compensation for LCD Display

An application Note

The optimal contrast setting for LCD displays varies with ambient temperature. For most
applications this variation in contrast is tolerable over the “normal” temperature range of 0°C to +50°C. Most LCD modules are available with an extended temperature range option
which allows the display to operate from-20°C to +70°C. The changes in contrast are NOT
usually tolerable over this wide a range of temperatures, which means a way of adjusting the contrast voltage as the ambient temperature changes must be provided

PDF =>
http://www.newhavendisplay.com/app_notes/Temperature_Compensation.pdf

GLCD Data Output Settings in Bitmap2LCD

Bitmap2LCD is a tool for programming small Graphic LCDs in embedded systems.

This article is only for releases before V2.5

Let’s look how to configure the GLCD data output settings :

The generated data array file (orange arrow, in the picture below) can be configured to meet the syntax requests of your compiler or assembler. There are many possible settings, to make it possible to match the tool with most of the compilers of the market.

At first, you define the table data settings (red arrow)

  • Data Width format. ( 8,16 or 32 bits data)
  • Binary, Hex or decimal format.
  • Syntax of Data Byte/Word (make it compatible with your favorite compiler, assembler)
  • Type of file (extension)

As next, you define the header syntax (green arrow)

  • Click on the button and the header script is loaded into the editor. Modify it to meet your requirements.
  • When ready, quit the header editor by clicking the same button (green arrow at the right) or the quit button. (script is auto-saved)
  • Find more about the header syntax at the end of this article.


As next, you define the way the data arrays are arranged to correctly fit in the DDRAM of your LCD controller. These settings must be compatible with the LCD display functions in the GLCD Library you use in your project (blue arrow)

  • The origin corner X0,Y0
  • Data direction (The direction in which the pixels slices are taken from the work canvas and converted to GLCD data, for example in slices or in full canvas height or full canvas width. A slice is 8 pixels in monochrome mode and 2 pixels in 4bpp grayscale mode)
  • The Endianness (Most Significant Bit is first or last)
  • Special settings


More about File Header syntax (green arrow)

The script components [&***] can be included only once and will be replaced by the data or value when the data array is generated. Not needed script components can be erased.

[&NAME]

The [$NAME] and the image size and position are optional and can be placed optionally anywhere in the header.

[&SIZE]

Same for Size of Data

[&TRUEORG]

This is the script component if present in the file, to indicate that you want to have the XPOS and YPOS origins of a reduced dynamic table of constants ( a part of the display you want to change ) given from the X0,Y0 corner you selected in the table translation manager window.

[&XPOS]

[&YPOS]

[&WIDTH]

[&HEIGHT]

The corner position on the Work Canvas and the size of the converted graphic area can be exported into the file.

There are additional script components for font generation and data compression.